Graph
Graphing sensor values

Changes in sensor values can be graphed in Xcratch. Click here to start sample project.
How to use the sample project
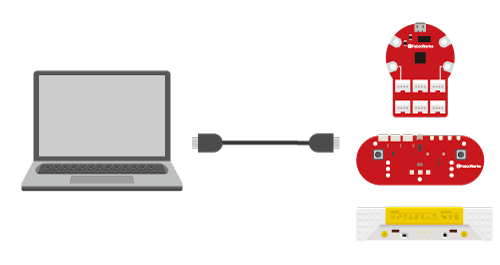
(1) Connect PC and AkaDako (or AkaDako STEAM Tool or Takoratch) with a USB cable. Then connect Grove’s sensors to AkaDako as needed. AkaDako STEAM Tool and Takoratch are equipped with environmental sensors (temperature, humidity, and barometric pressure), light sensor, acceleration sensor, and distance sensor.
* Check here for notes on connecting to a PC.
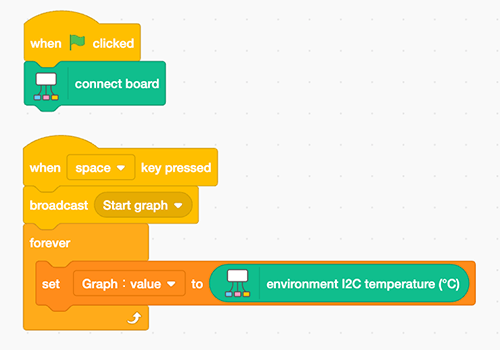
(2) Go to sample project of graph drawing. This sample project is designed to draw a graph of temperature. Let’s press the space key after clicking on the green flag. A graph of temperature change begins to be drawn on the right side of the screen.
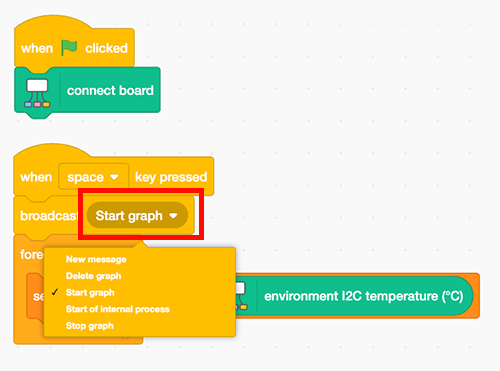
(3) If you want to stop or delete graph drawing, select instructions from the pull-down menu on the broadcast block.
Customize variables
In the sample project, some variables are provided. Variables can be changed depending on the situation.

Default value of Graph: sampling cycle (sec) is 1. If you want to change the interval at which sensor values are retrieved, change the value and place the block.

Default value of Graph: drawing cycle (sec) is 1. If you want to change the interval at which the graph is drawn, change the value and place the block.
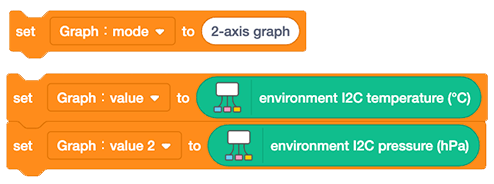
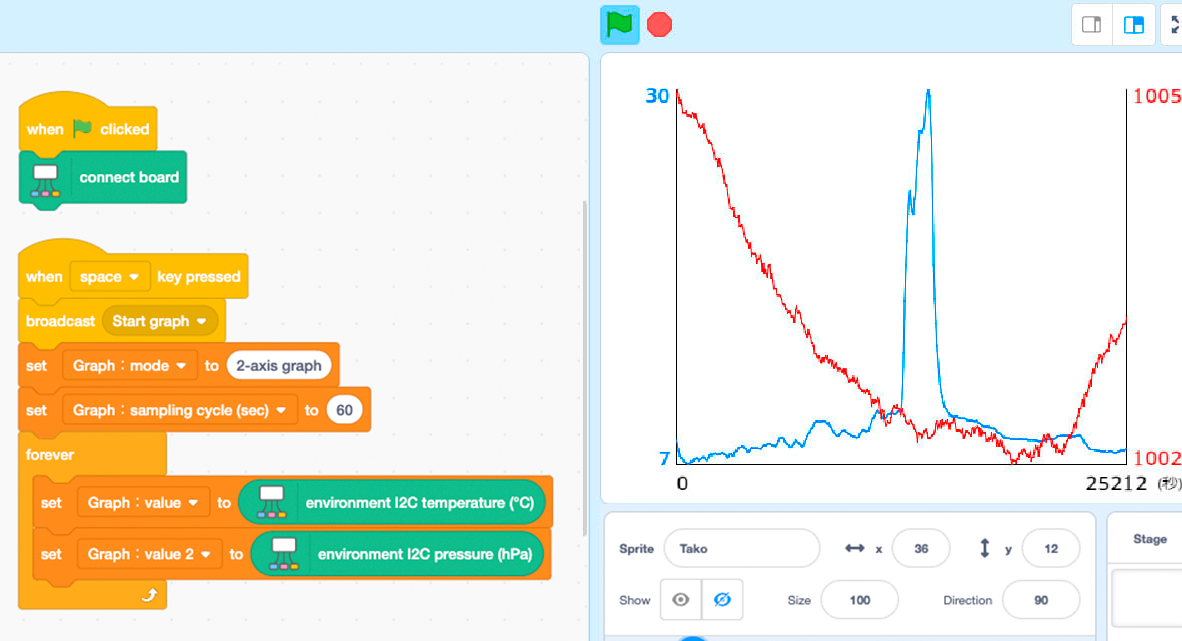
Default value of Graph: mode is “graph”. Setting the graph mode value to “2-axis graph” and place the block, 2 types of values can be used for graphs. For example, changes in temperature and pressure values can also be graphed simultaneously.
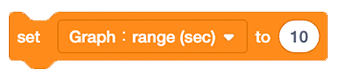
Default value of Graph: range (sec) is 0, which displays all data. Setting the value to 10, a graph of the last 10 seconds of data is displayed.